Project Info
Client:
Bayer
Bayer
Role:
UI/UX Designer
UI/UX Designer
To support People Leaders in managing teams and organisational performance, we designed two interconnected dashboards—Talent Cockpit and Human Capital Cockpit. Both dashboards provide a clear overview of organisational and team-level data, helping leaders make informed decisions such as rewarding talent, tracking performance and potential, and planning for succession. For higher-level insights, select leaders can also access organisational data on diversity, hiring, engagement, and attrition, enabling a holistic view of workforce health and long-term sustainability.
Note: All data presented in this project are mock figures and do not represent the actual numbers of the organisation. For confidentiality reasons, certain sections of the mock-ups (such as internal sensitive metrics and frameworks) have been intentionally blurred or omitted.
Dashboard Features
Each cockpit provides a modular view of key workforce data, with metrics visualised through a traffic light status system for quick interpretation, while allowing leaders to drill down into detailed reports when needed.
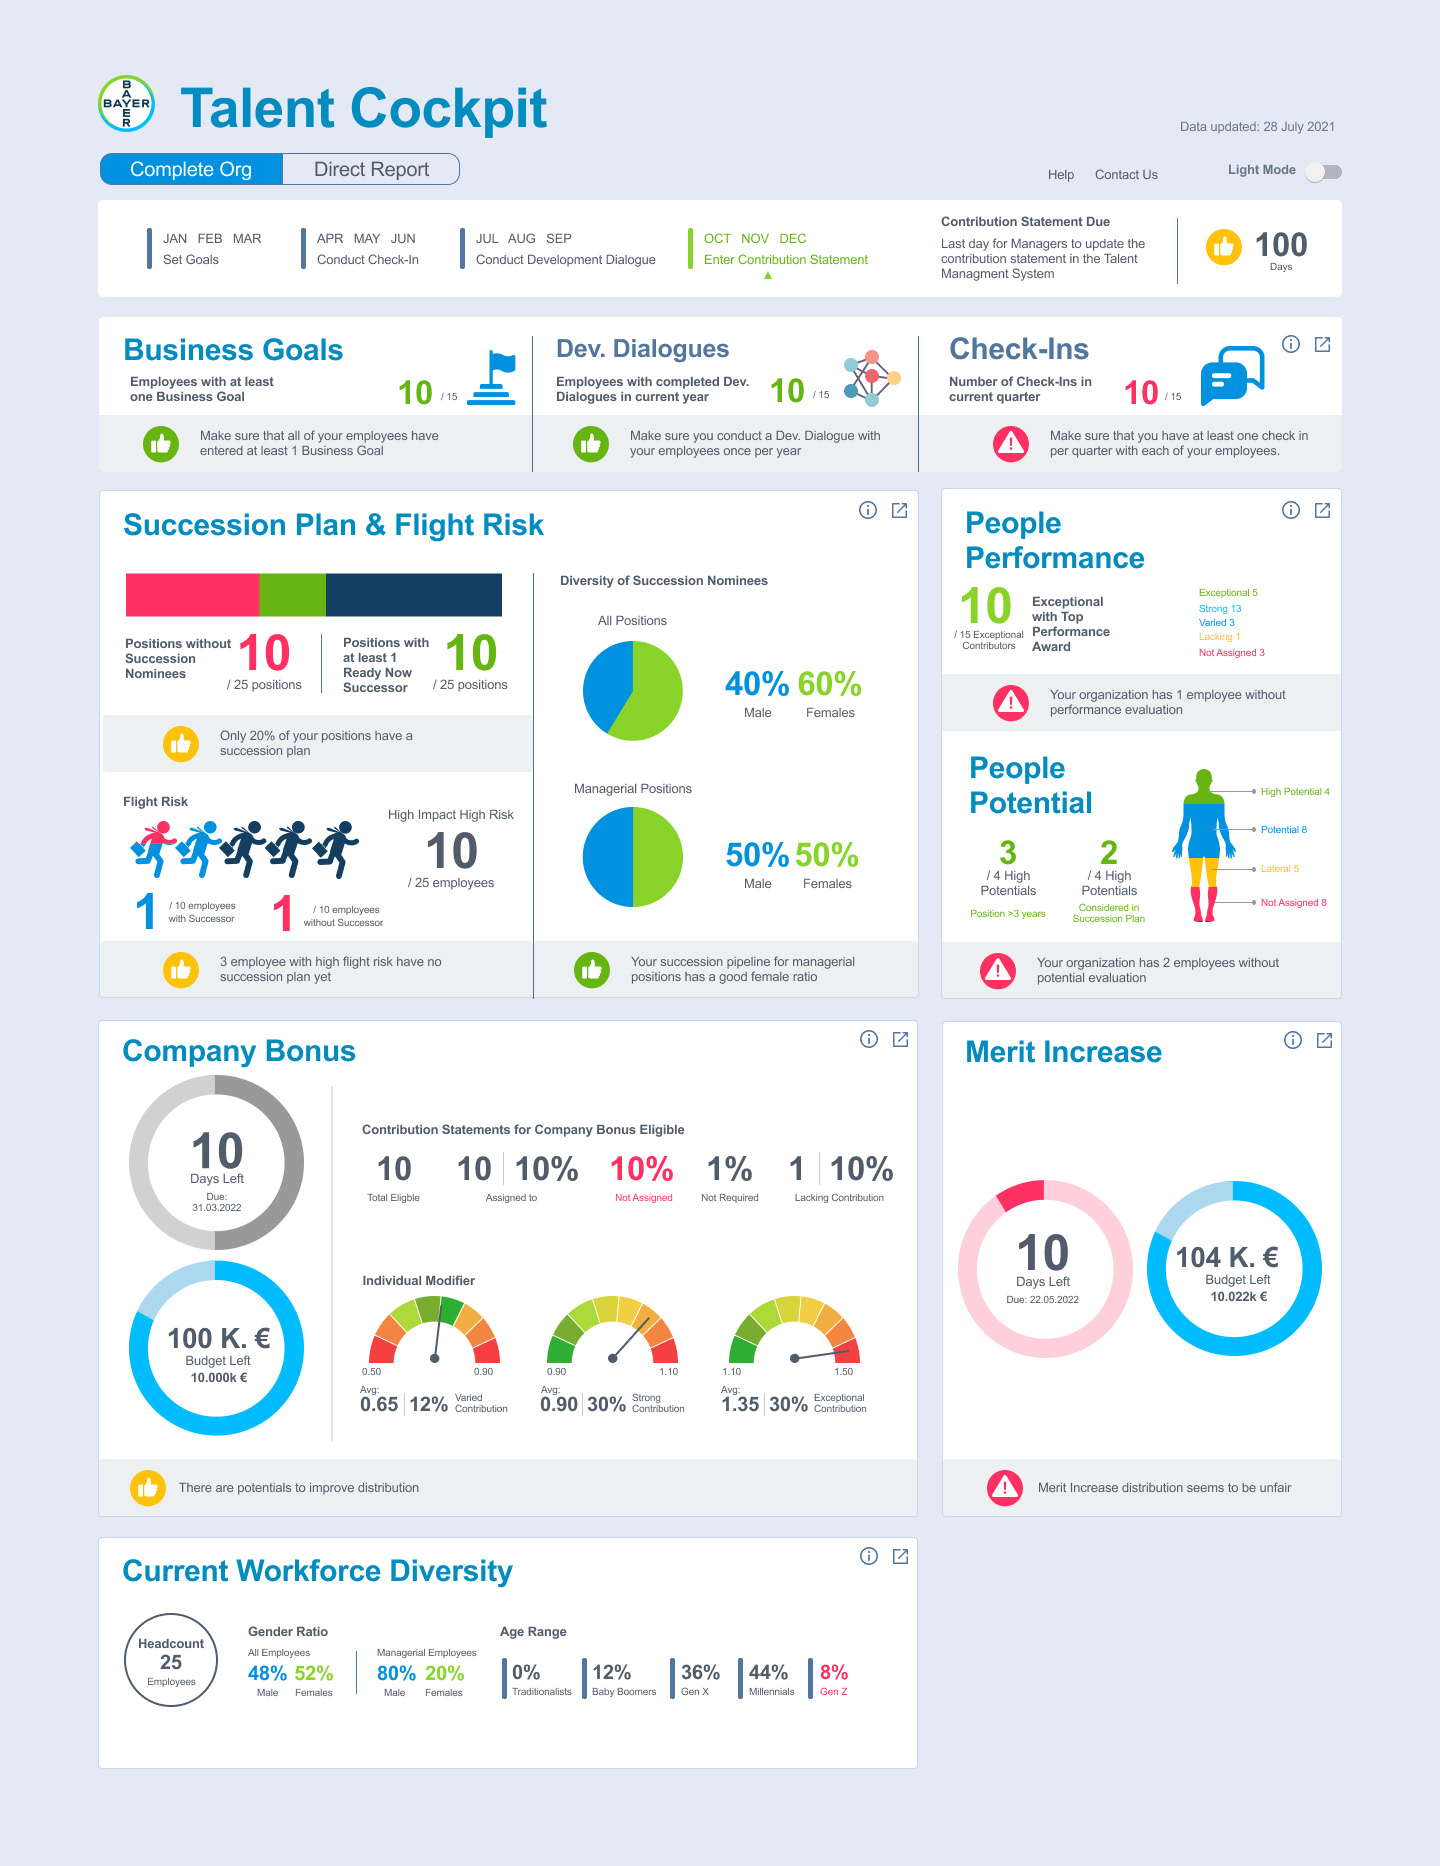
Talent Cockpit focuses on the team level, offering insights into:
- Business goals and check-ins (completion tracking)
- Succession planning and flight risk, with diversity considerations
- Performance and potential distribution (including HiPo tracking)
- Bonus and merit increase budget usage
- Workforce diversity across gender and age groups
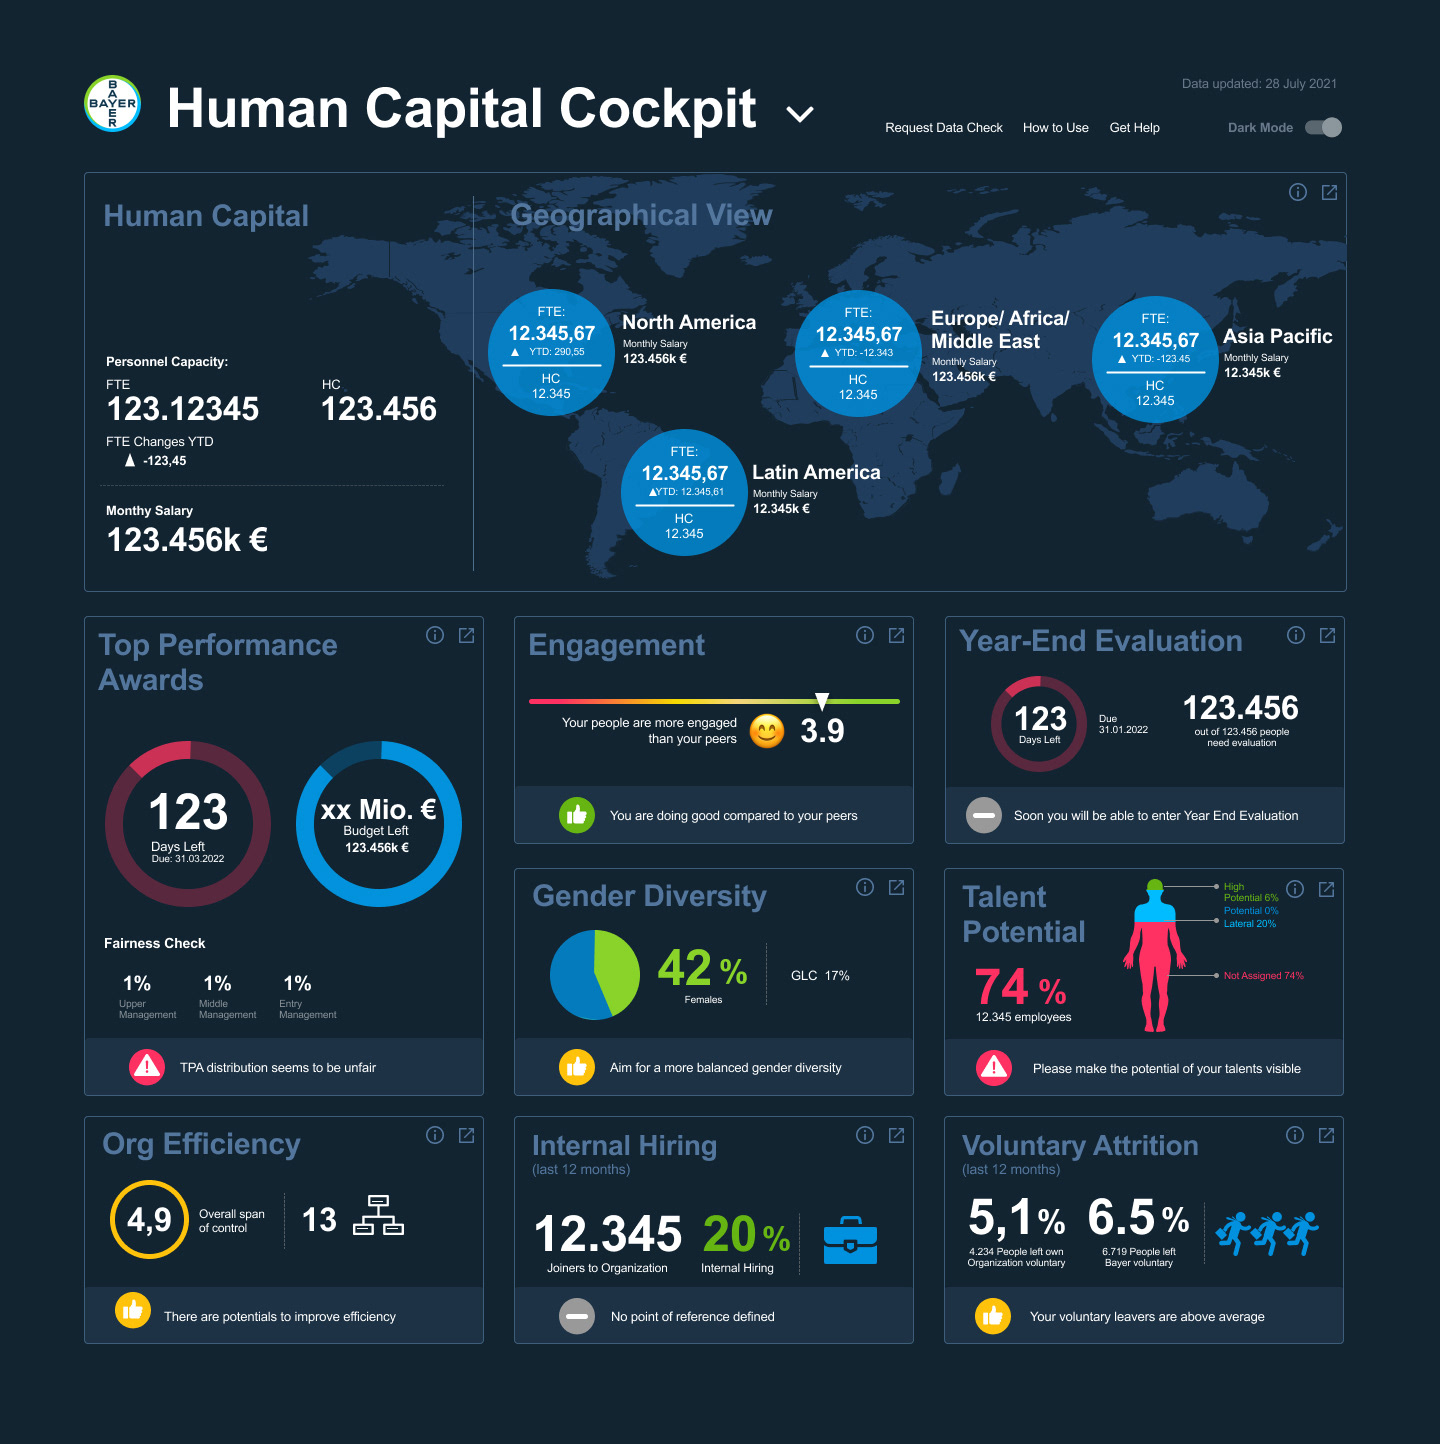
Human Capital Cockpit provides an organisational overview, covering:
- Geographical salary and workforce data
- Engagement and recognition programs (e.g., performance awards)
- Year-end evaluation progress and deadlines
- Diversity and inclusivity measures
- Hiring and attrition trends
- Organisational efficiency
- Geographical salary and workforce data
- Engagement and recognition programs (e.g., performance awards)
- Year-end evaluation progress and deadlines
- Diversity and inclusivity measures
- Hiring and attrition trends
- Organisational efficiency
Design Challenges & Approach
One of the biggest challenges was presenting large, complex datasets in digestible modules. We needed to strike a balance between overview vs. detailed data, ensuring scalability for future modules while maintaining layout consistency. Data consolidation and prioritisation were key—deciding what to group, what to highlight, and how to structure the hierarchy of information. Multiple iterations were required to align with Bayer’s internal metrics and talent frameworks before arriving at a dashboard design that was both intuitive and flexible.
Detailed Report
Examples:
- Performance & Potential (2nd Layer Report)
- Performance Distribution - by Employee List (3rd Layer Report)
Examples:
- Performance & Potential (2nd Layer Report)
- Performance Distribution - by Employee List (3rd Layer Report)
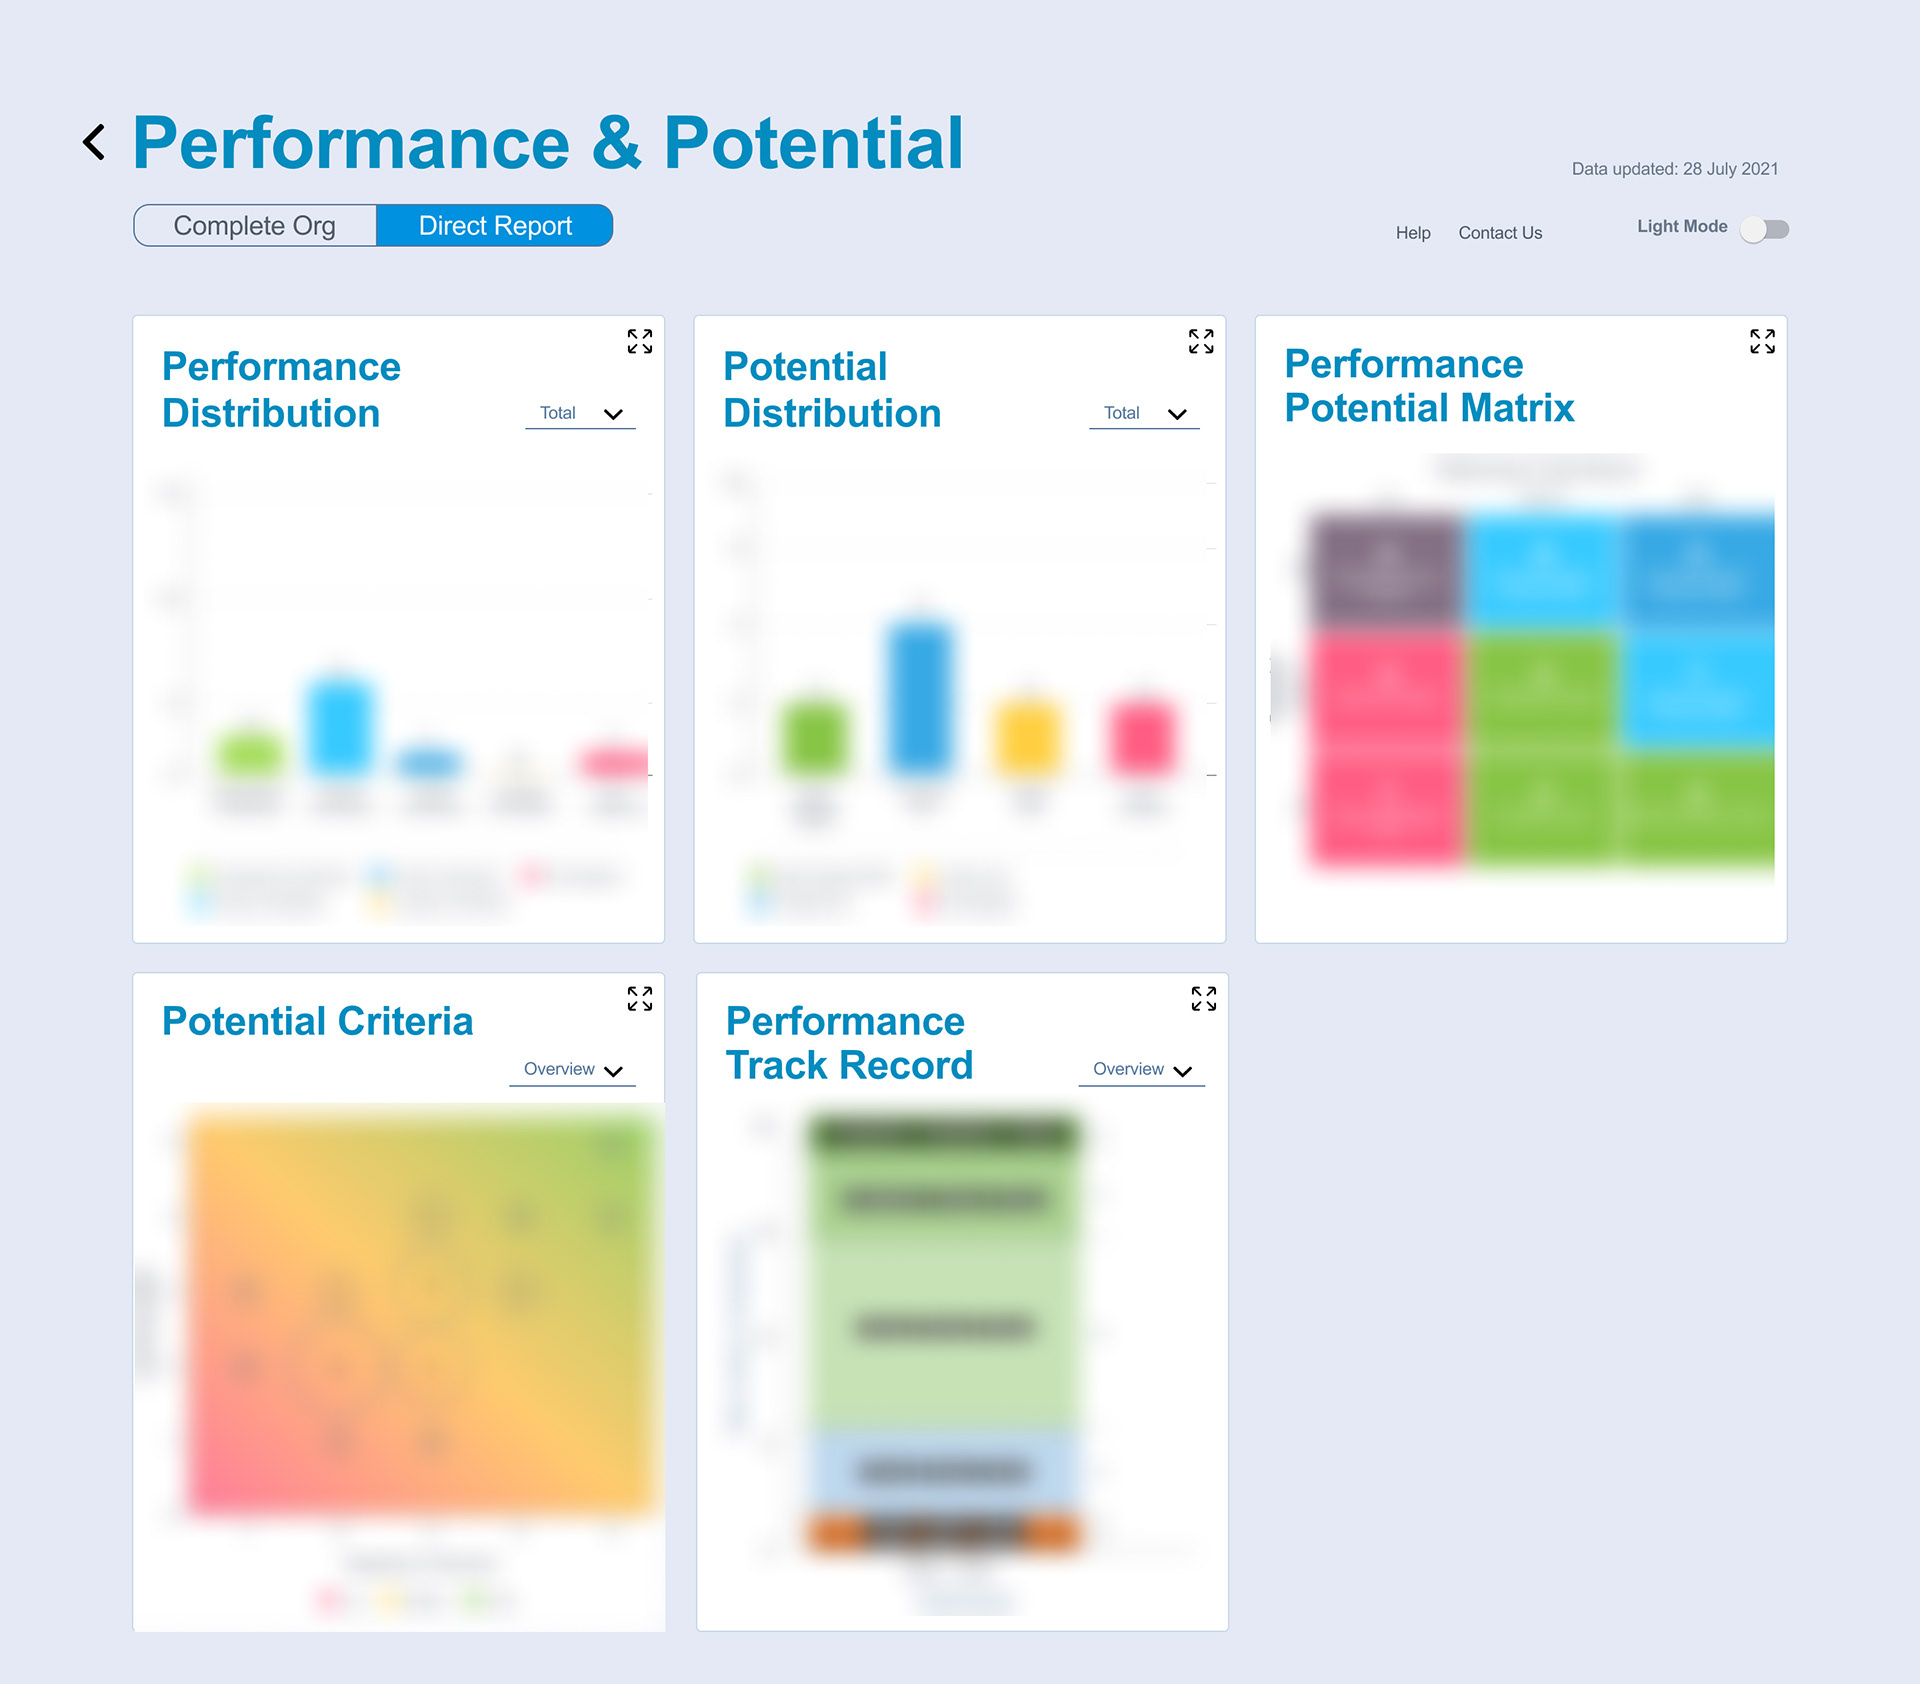
Performance & Potential (2nd Layer Report)
This 2nd layer of report extends the same modular dashboard design into a deeper level of analysis, giving People Leaders clearer visibility of how individuals and teams are assessed. Each module highlights specific metrics—such as contribution ratings, potential distribution, and performance trends—making it easier to evaluate employees consistently across the organization. The 9-box matrix, which maps performance records against potential, helping leaders identify high-potential employees, track under performers, and make more informed talent decisions.
This 2nd layer of report extends the same modular dashboard design into a deeper level of analysis, giving People Leaders clearer visibility of how individuals and teams are assessed. Each module highlights specific metrics—such as contribution ratings, potential distribution, and performance trends—making it easier to evaluate employees consistently across the organization. The 9-box matrix, which maps performance records against potential, helping leaders identify high-potential employees, track under performers, and make more informed talent decisions.
While still providing an overall team overview, the modular design allows flexibility. Leaders can expand individual modules to reveal more granular insights. Once expanded, these modules trigger a detailed pop-up list of employees, ensuring that leaders can move seamlessly from high-level insights into specific employee data without losing context. This layered approach keeps the interface clean while allowing deeper exploration when needed.
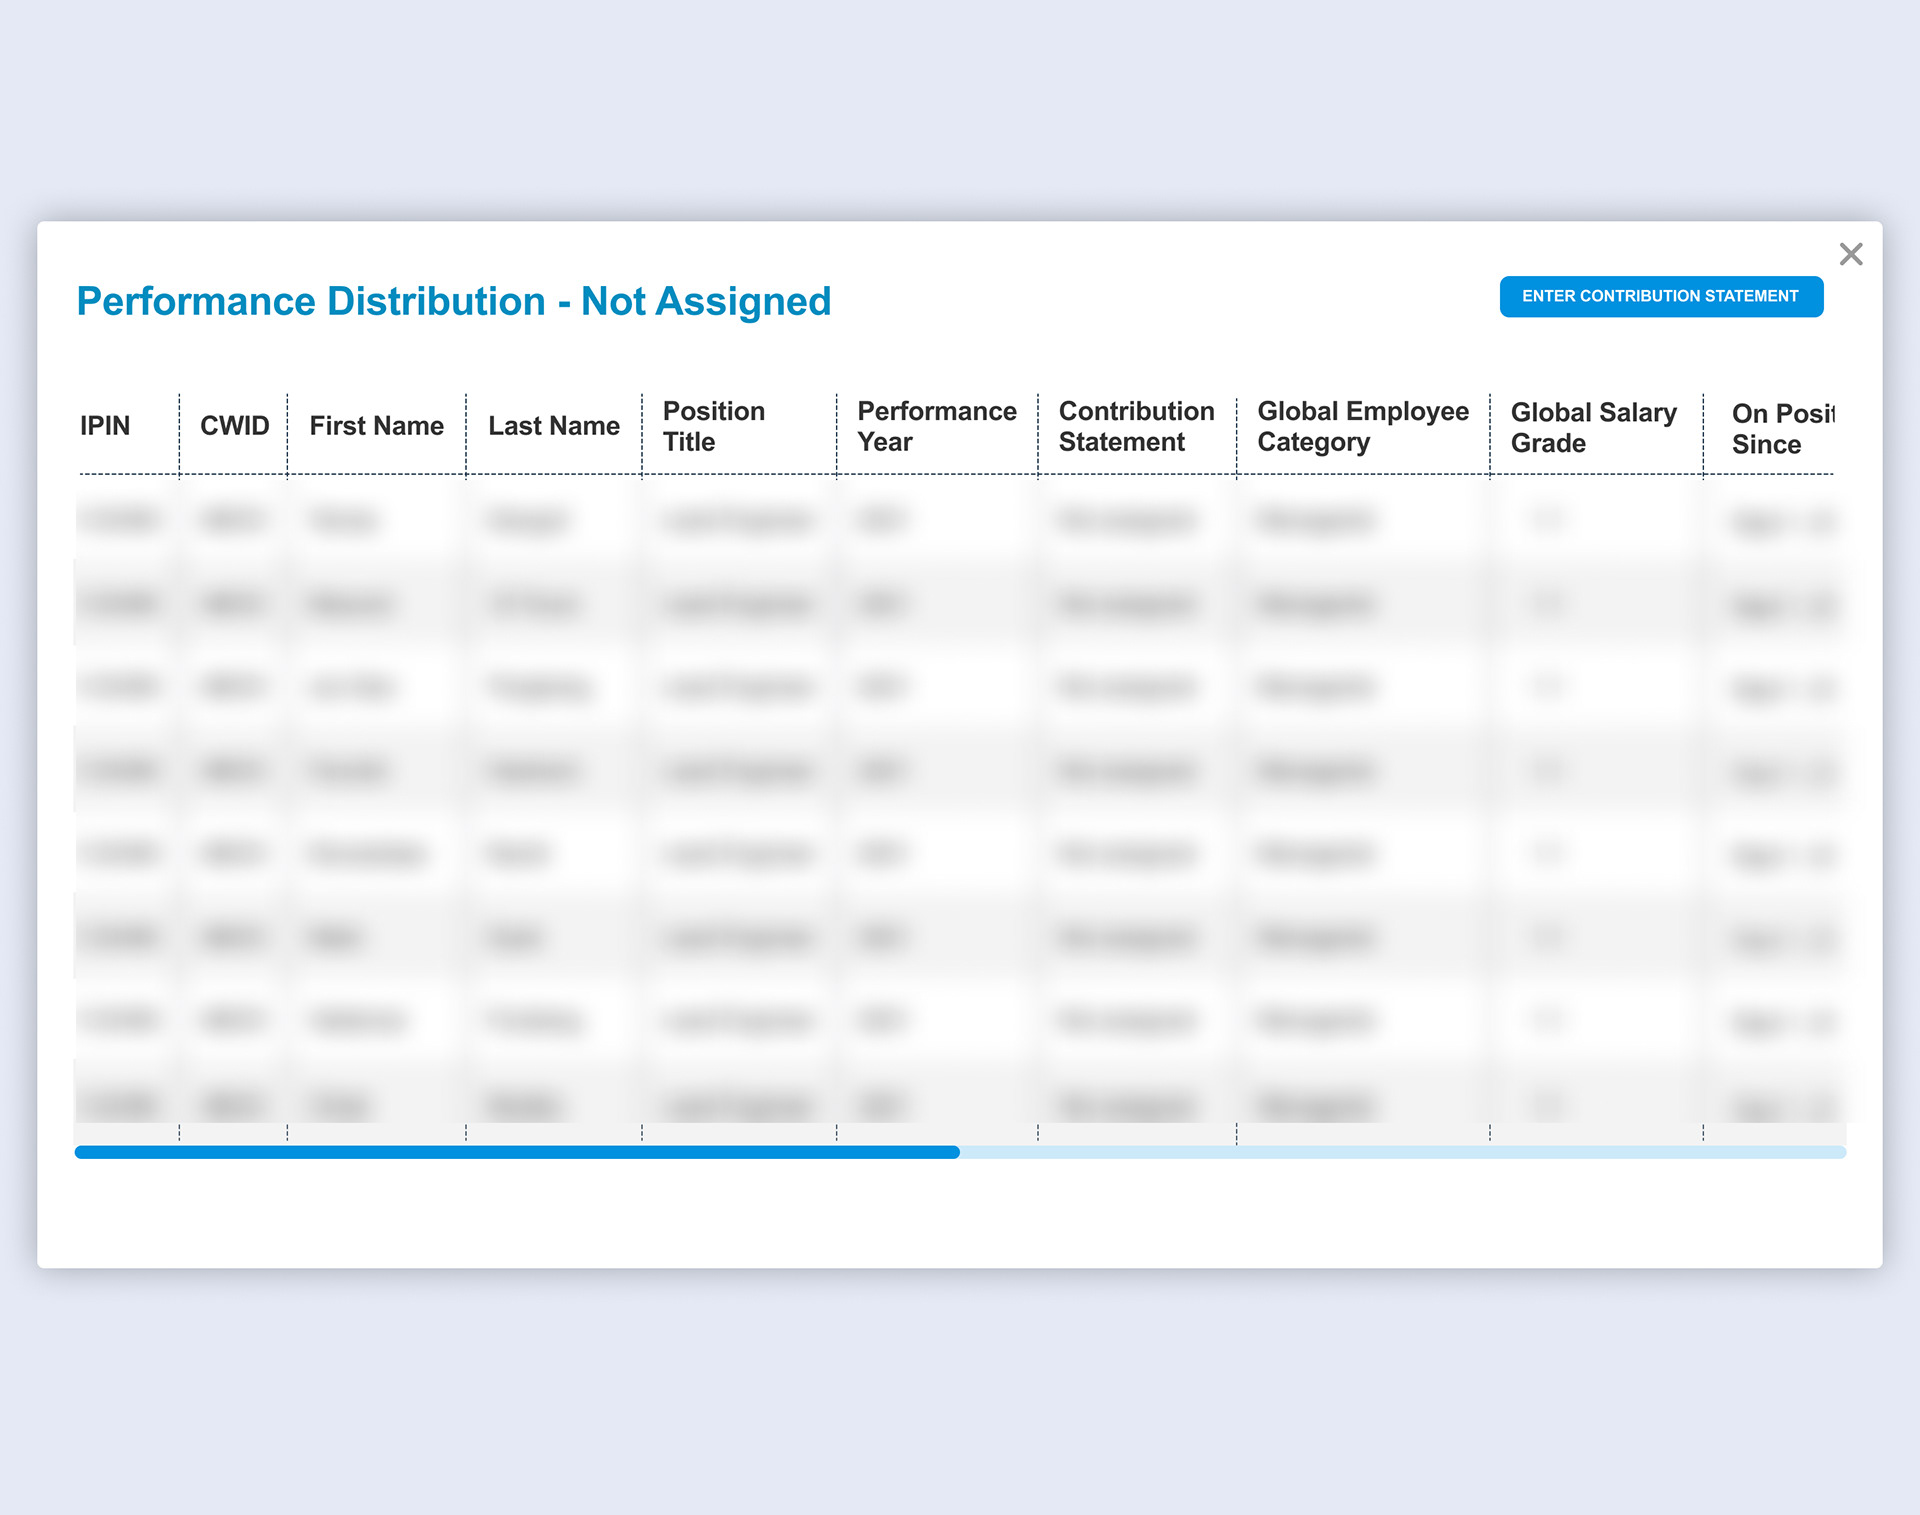
Performance Distribution by Employee List (3rd Layer Report)
At the third layer, the list presents data in a structured table view, displaying key details such as employee position, salary grade, start dates, and performance year etc. This level of detail gives People Leaders a more complete picture of their teams and helps connect performance outcomes with career progression, tenure, and role responsibilities. The table format ensures that leaders can quickly compare and reference employee-specific data, complementing the visual summaries from earlier layers.
At the third layer, the list presents data in a structured table view, displaying key details such as employee position, salary grade, start dates, and performance year etc. This level of detail gives People Leaders a more complete picture of their teams and helps connect performance outcomes with career progression, tenure, and role responsibilities. The table format ensures that leaders can quickly compare and reference employee-specific data, complementing the visual summaries from earlier layers.
This view also introduces actionable items, most notably the ability to enter a contribution statement per employee. While this feature was not fully explored in the mock-up stage of the project, it was envisioned as a way for leaders to provide performance context and justification directly within the system. By embedding these actions alongside the data, the report supports a more efficient workflow, enabling leaders to move from insight to decision-making without switching platforms.